Corporate Financial Analysis of Safestore Holdings Plc
For a critical analysis of the corporation’s financial performance, I have chosen Safestore Holdings Plc which is listed and traded on the London Stock Exchange. In this report (Corporate Financial Analysis of Safestore Holdings Plc), I will do an in-depth evaluation of alternative capital structure theories and their implications for Safestore. Here I will also analyze the recent investment activities taken by “Safestore” and its main competitor “Big Yellow Group Plc” during the past five years which has a direct impact on their business performance. Over the last five years, Safestore is reaching an excellent position in the capital market and its business is experiencing significant growth of double-digit. The total group revenue increased by 10.8%. The group occupancy increased by 2.7 percentage points. The focus of management remains on the existing store portfolio and filling the 1.7m square feet of available capacity, building on the operational improvements developed over the last five years.
About Safestore Holdings Plc
Safestore Holdings public limited company is a UK based real estate investment trust. The Company and its subsidiaries “Safestore” provide self-storage facilities to customers throughout the United Kingdom (UK) and Paris. Safestore is one of the UK’s largest self-storage group with 145 stores across the UK and in Europe. They have 118 wholly-owned stores in the UK including 45 in London. Safestore was started its journey in 1998. In 2014 it acquired the French business “Une Pièce en Plus” with 25 stores, which was founded in 1998 by the current Safestore Group CEO Frederic Vecchioli. In 2007 Safestore listed in the London Stock exchange. The current market capitalization is £1,343.26 million and the current year market average price is £606. The Group provides storage service to approximately fifty-five thousand personal, students and business customers across UK and Paris.
| Customers | UK | Paris |
| Personal Customers | ||
| Numbers (% of total) | 74% | 83% |
| Square feet occupied (% of total) | 53% | 66% |
| The average length of stay (months) | 20.2 | 26.4 |
| Business Customers | ||
| Numbers (% of total) | 26% | 17% |
| Square feet occupied (% of total) | 47% | 34% |
| The average length of stay (months) | 30.5 | 32.2 |
Around 550 people employed by Safestore in the UK and France. The main segment market of this company London and South East, the Rest of England, France, Paris, Scotland, and Wales. The core business portfolio includes personal storage, business storage, and student storage. In addition to Safestore, they have Safestore Investments Limited, Assay Insurance Services Limited, Crown Self Storage (Exeter) Limited, Stork Self Storage (Holdings) Ltd., Compagnie de Libre Entreposage France SAS, and Access Storage Holdings. Currently, around 30% of our stores in the UK are leaseholds with an average remaining lease length on 31 October 2018 of 12.5 years (FY2017: 13.3 years). Although the property valuation for leaseholds is conservatively based on future cash flows until the next contractual lease renewal date, Safestore has a demonstrable track record of successfully re-gearing leases several years before renewal whilst at the same time achieving concessions from landlords (Safestore, 2018).
Safestore is become the UK’s number one choice in self-storage solution, has been awarded as a leader in people management practice globally. Having been shortlisted as a Gold Employer of the Year 2018 in 250+ category in The Investors in People Awards. Safestore’s recent growth has been sustained by the acquisitions of “Space Maker” and “Alligator Self Storage”. Over the year the Safestore has been experiencing significant growth in its revenue.
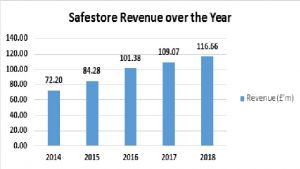
Fig: Revenue of Safestore (Source: Annual Report of Safestore)
Major Competitor of Safestore Holdings Plc
According to “StorageMonkey”, there are nine major competitors of Safestore, where Big Yellow Group Plc is listed and traded.
- Big Yellow Group Plc
- Access Self Storage
- Shurgard Self Storage UK
- Lok’nStore Group Plc
- Storage King
- StorageMart
- Lock Stock Self Storage
- Ready Steady Store
- Sentry Self Storage
About Big Yellow Group Plc
Big Yellow is the leading self-storage solution provider in the UK. We are the pioneer of offering the latest generation of self-storage facilities where the state of the art technology and are located in high profile, convenient, main road locations in UK.
Our always focus on expansion and we now have 75 self-storage centers to provide superior service. We have developed a strong network across the UK, with attention on London and the South, and other large metropolitan areas (Big Yellow Group, 2018).
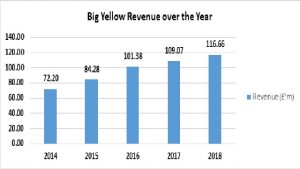
Fig: Revenue of Big Yellow (Source: Annual Report of Big Yellow Group)
Service Comparison of Different Storage Companies in UK
| Company | No. of stores in UK | Total space (sqft) | Services |
| Big Yellow Group Plc | 96 | 5,500,000 | They are the premium storage provider like a five-star hotel for your boxes of stuff. Their storage solution and customer service are excellent. |
| Safestore Holdings Plc | 120 | 5,000,000 | Safestore is the second-largest storage solution provider in UK with 120 stores. There aren’t many places in the UK where you can’t find one of their big stores of Safestores. |
| Access Self Storage | 57 | 2,950,000 | You can have access to high-quality sites all over London. They offer very competitive prices to be very competitive and their service quality is exceptional. |
| Shurgard Self Storage UK | 28 | 1,600,000 | Impressive, purpose-built self-storage facilities. If you want the best for your stuff then look no further |
| Lok’nStore Group Plc | 29 | 1,400,000 | Lok’nStore operates a portfolio of over 27 stores across the South East. They offer a wide range of storage solutions in handy locations. We found their prices to be some of the most competitive in the market. |
| Storage King | 26 | 920,000 | Storage King offers state-of-the-art security including 24-hour CCTV, temperature-controlled environment, flexible rental terms, large drive-in loading bays, and free and easy access |
| StorageMart | 16 | 675,000 | StorageMart (formerly Big Box Storage) is a high-quality operator with facilities throughout England. They never charge customers a security deposit and they don’t require a minimum length of stay. |
| Lock Stock Self Storage | 17 | 510,000 | They offer a quality product and they like to keep the whole storage process straightforward and transparent for their customers |
| Ready Steady Store | 15 | 510,000 | They offer competitive pricing and great customer service. |
| Sentry Self Storage | 18 | 275,500 | Sentry Self storage solution modern operative facility with CCTV, floodlighting, alarms system and electronic access control to ensure the safety of your goods. |
Analysis of Financial Performance
To evaluate the financial performance of the chosen company here we will do ratio analysis (liquidity and leverage ratio) for the 5 years. Ratio analysis is the most common way of evaluation of the performance of a company.
Liquidity Ratio
The liquidity of a firm is measured by its ability to pay back its short-term obligations as they become due. Liquidity refers to the solvency of a company’s overall financial position. Because a common reason of financial distress and bankruptcy is low or declining liquidity, these ratios can provide early signs of cash flow problems and impending business failure. Liquidity is a key financial indicator that measures whether the firm has the ability to fulfill its debt commitments (Maziar Ghasemi & Nazrul Hisyam Ab Razak, 2016). However, liquid assets, like cash kept at banks and stock of marketable securities, do not earn a particularly high rate of return, so shareholders will not want a firm to overinvest in liquidity. Firms have to balance the need for safety that liquidity provides against the low returns that liquid assets generate for investors. A higher current ratio indicates a greater degree of liquidity. The two basic measures of liquidity are the current ratio and the quick (acid-test) ratio (Gitman, Lawrence J. Zutter, and Chad J., 2014). You can also calculate the cash ratio to see the liquidity position of a company.
-
Current Ratio
The current ratio, one of the most commonly cited financial ratios, measures the firm’s ability to meet its short-term financial obligations. How much liquidity a firm needs to maintain depends on a variety of factors, including the company size, its access to short-term financing sources like bank credit lines, and the volatility of its business. A higher current ratio indicates a better position of liquidity. The current ratio is calculated as follows:
Current Ratio = (Current asset/Current Liabilities)
| Safestore Holdings Plc | |||
| Year | Current Assets (£’m) | Current Liabilities (£’m) | Current Ratio |
| 2014 | 36.20 | 49.70 | 0.73 |
| 2015 | 33.40 | 44.40 | 0.75 |
| 2016 | 28.60 | 53.80 | 0.53 |
| 2017 | 89.30 | 55.60 | 1.61 |
| 2018 | 33.20 | 52.20 | 0.64 |
Safestore is maintaining an average level of current asset ratio which is close to the industry average. From the above historical data, we can see that in 2017 this company had above average amount of current assets to pay off its current liabilities, this indicates that this company was holding more current assets at their hand.
| Big Yellow Group Plc | |||
| Year | Current Assets (£’m) | Current Liabilities (£’m) | Current Ratio |
| 2018 | 25.72 | 41.36 | 0.622 |
Current Ratio Comparison: From the above calculation you can clearly see that both the company Safestore and Big Yellow is maintaining the same level of a current asset for their business operations.
-
Quick Ratio
The quick or acid-test ratio is similar to the current ratio except that it excludes inventory, which is generally the least liquid current asset. Low liquidity of inventory results from two primary factors: (a) inventory cannot be easily sold because they are partially completed items, special-purpose items, and (b) inventory is typically sold on credit, which means that it becomes an account receivable before being converted into cash. An additional problem with inventory as a liquid asset is that the times when companies face the most need for liquidity when business is bad, are precisely the times when it is most difficult to convert inventory into cash by selling it (Gitman, Lawrence, and Chad, 2014). The quick ratio is calculated as follows:
Quick Ratio = (Current Asset-Inventories-Prepaid expenses/Current Liabilities)
| Safestore Holdings Plc | ||||
| Year | Current Assets (£’m) | Inventories (£’m) | Current Liabilities (£’m) | Quick Ratio |
| 2014 | 36.20 | 0.20 | 49.70 | 0.72 |
| 2015 | 33.40 | 0.20 | 44.40 | 0.75 |
| 2016 | 28.60 | 0.20 | 53.80 | 0.53 |
| 2017 | 89.30 | 0.20 | 55.60 | 1.60 |
| 2018 | 33.20 | 0.20 | 52.20 | 0.63 |
Over the years the company is keeping the same level of inventories. They actually sell service to their customers that’s they do not have much inventory to maintain. Another thing is that the difference between the current ratio and liquidity ratio is more or less similar because of the minimum amount of inventory and prepaid expenses. Another thing is that in the year 2017 they had a huge amount of current assets compared with the current liabilities.
| Big Yellow Group Plc | ||||
| Year | Current Assets (£’m) | Inventories (£’m) | Current Liabilities (£’m) | Quick Ratio |
| 2018 | 25.72 | 0.28 | 41.36 | 0.615 |
As a larger company, the Big Yellow group is maintaining more inventories compared with the Safestore which looks normal from my analysis.
-
Cash Ratio
A company’s most liquid assets are cash and marketable securities, that’s why analysts also look at the cash ratio. A low cash ratio may not matter if the firm can borrow money on short notice. Who cares whether the company has actually borrowed from the bank or whether it has a guaranteed line of credit that lets it borrow whenever it chooses? None of the standard measures of liquidity takes the firm’s “reserve borrowing power” into account. If the firm is able to generate significant cash quickly from its ongoing business operation then it might be highly liquid even if these ratios are poor (Richard A. Brealey, Stewart C. Myers, and Alan J. Marcus, 2017). The cash ratio is calculated as follows:
Cash Ratio= (Cash and Cash Equitables/Current Liabilities)
| Safestore Holdings Plc | |||
| Year | Cash & Cash Equivalents (£’m) | Current Liabilities (£’m) | Cash Ratio |
| 2014 | 15.30 | 49.70 | 0.31 |
| 2015 | 13.80 | 44.40 | 0.31 |
| 2016 | 5.40 | 53.80 | 0.10 |
| 2017 | 65.60 | 55.60 | 1.18 |
| 2018 | 10.50 | 52.20 | 0.20 |
Over the year Safestore is maintaining a good amount of cash and cash equivalents compared with the current liabilities which is above the average of the industry average. You can see from the above data that in the year 2017 this company has a huge amount of cash and cash equivalents in their hand which they had kept for business expansion purposes. Finally, as per their requirement, they are maintaining a good amount of cash on their hands for regular business operations.
| Big Yellow Group Plc | |||
| Year | Cash & Cash Equivalents (£’m) | Current Liabilities (£’m) | Cash Ratio |
| 2018 | 6.85 | 41.36 | 0.17 |
Cash Ratio Comparison: Big Yellow is the market leader in the storage solution industry in UK, they are maintaining less cash and cash equivalents compared with Safestore which indicates that they finance their current liabilities more in the form of cash.
Leverage Ratio
Long-term solvency ratios are the measures to identify the firm’s long-run ability to meet its obligations or, more generally, its financial leverage. These ratios are called financial leverage ratios or just leverage ratios (Stephen A. Ross, Jeffrey F. Jaffe, and Randolph W. Westerfield, 2017)
-
Debt Ratio
The debt ratio measures the proportion of total assets are financed by the company’s creditors. The higher this ratio, the greater the amount of debt finance is used to generate profits. The debt ratio is calculated as follows:
Debt Ratio = (Total debt/Total Assets) x 100
| Safestore Holdings Plc | |||
| Year | Total Debt (£’m) | Total Assets (£’m) | Debt Ratio |
| 2014 | 446.50 | 804.80 | 0.55 |
| 2015 | 421.50 | 867.70 | 0.49 |
| 2016 | 533.30 | 1066.90 | 0.50 |
| 2017 | 574.50 | 1156.60 | 0.50 |
| 2018 | 578.10 | 1314.50 | 0.44 |
The financial performance of Safestore is looking good over the years. If you see the ratio of 2014 it was 55% this means that they used to use more debt funds to manage their assets but with the time passes their debt amount is reducing compared with the assets. Definitely this a good sign. The company is doing well and they are reducing their debt obligations.
| Big Yellow Group Plc | |||
| Year | Total Debt (£’m) | Total Assets (£’m) | Debt Ratio |
| 2018 | 388.69 | 1369.84 | 0.28 |
Debt Ratio Comparison: Look at the figure of a market leader “Big Yellow Group Plc” they had only 25% of debt which is used to collect to manage their assets. This is possible because of their strong financial strength compared with other companies belonging to the same market.
-
Debt to Equity Ratio
The debt to equity ratio measures the relative amount of total liabilities to stockholder’s equity used to finance the company’s assets. The higher this ratio, the greater the firm’s use of financial leverage.
The debt-equity ratio is calculated as follows:
Debt Equity Ratio = (Total Debt/Shareholder’s Equity) x 100
| Safestore Holdings Plc | |||
| Year | Total Debt (£’m) | Total Equity (£’m) | Debt to Equity Ratio |
| 2014 | 446.50 | 408.00 | 1.09 |
| 2015 | 421.50 | 490.60 | 0.86 |
| 2016 | 533.30 | 587.40 | 0.91 |
| 2017 | 574.50 | 637.70 | 0.90 |
| 2018 | 578.10 | 788.60 | 0.73 |
Over the year Safestore holdings are using less financial leverage for their business. This means that their equity amount is increasing year to year, which is a good sign that the company is doing good over the year.
| Big Yellow Group Plc | |||
| Year | Total Debt (£’m) | Total Equity (£’m) | Debt to Equity Ratio |
| 2018 | 388.69 | 981.15 | 0.40 |
Debt Equity Ratio Comparison: From the above data it is clearly visible that Big yellow group is using less leverage for their business operation compared with the Safestore. And it is also the indicator of being more financially strong.
-
Financial Leverage Ratio
The financial leverage ratio is used to identify how much debt a company is using to finance its assets. A high ratio means the firm is highly levered. A low ratio indicates that the company is less levered. The financial leverage ratio is calculated as follows:
Financial Leverage Ratio = (Total Asset/Total Equity) x 100
| Safestore Holdings Plc | |||
| Year | Total Assets (£’m) | Total Equity (£’m) | Financial Leverage Ratio |
| 2014 | 804.80 | 408.00 | 1.97 |
| 2015 | 867.70 | 490.60 | 1.77 |
| 2016 | 1066.90 | 587.40 | 1.82 |
| 2017 | 1156.60 | 637.70 | 1.81 |
| 2018 | 1314.50 | 788.60 | 1.67 |
Previous Safestore is using more financial leverage compared with recent years. This means that the company is using less fixed expense financing to managed their assets.
| Big Yellow Group Plc | |||
| Year | Total Assets (£’m) | Total Equity (£’m) | Financial Leverage Ratio |
| 2018 | 1369.84 | 981.15 | 1.40 |
Financial Leverage Ratio Comparison: Big Yellow Group Plc has less financial leverage compared with the Safestore for the year 2018. This is happening because of the more equity funds they had over the years.
-
Interest Coverage Ratio
The times interest earned ratio, also called the interest coverage ratio, measures the company’s ability to make interest payments of taken loan. The higher its value, the better able the firm is to fulfill its interest obligations. The interest coverage ratio is calculated as follows:
Interest Coverage Ratio = (EBIT/Interest expense)
| Safestore Holdings Plc | |||
| Year | EBIT (£’m) | Interest Expense (£’m) | Interest Coverage Ratio |
| 2014 | 75.6 | 27.90 | 2.71 |
| 2015 | 134.2 | 19.20 | 6.99 |
| 2016 | 109.3 | 35.40 | 3.09 |
| 2017 | 109.6 | 36.80 | 2.98 |
| 2018 | 197.6 | 13.00 | 15.20 |
In 2014 Safestore had only 2.71 times capability to repay its fixed interest payment obligations but at the end of the year its increased by 15.20 times. This indicates that the company’s financial strength increasing over the years and their business also growing.
| Big Yellow Group Plc | |||
| Year | EBIT (£’m) | Interest Expense (£’m) | Interest Coverage Ratio |
| 2018 | 143.21 | 11.98 | 11.96 |
Interest Coverage Ratio Comparison: Big Yellow although doing well over the years but if you check the interest coverage ratio of Safestore and Big yellow you can easily identify that big yellow is doing very extremely well in the storage industry in UK. In 2018 the Big Yellow’s payment capabilities is 11.96 times where for Safestore it is 15.20 times.
A Review the alternative capital structure theory and their implications
The literature highlights the importance of asymmetric information, agency problem, taxation and corporate control in determining the choice between debt and equity. There are costs and benefits of choosing a certain financing policy, choosing debt or and equity, therefore the optimum choice will be based on the tradeoffs of these costs and benefits a company will get.
Literature Review on the Theory of Capital Structure
- Modigliani and Miller conducted a revolutionary study on the theory of capital structure and proposed that the theory that the capital structure of the company has nothing to do with the company value in the complete market is the MM theory (Modigliani-Miller, 1958)
- Robichek and others proposed a trade-off theory. When enterprises decide the capital structure, they must weigh the tax avoidance effect and bankruptcy cost of liabilities.
- Jesen and Meckling proposed agency cost theory. The theory distinguishes between two companies’ conflicts of interest: the cost of equity agency caused by conflicts of interest between shareholders and managers, and the cost of debt agency caused by conflicts of interest between creditors and shareholders (Jensen and Meckling, 1978; Jensen, 1986).
- Ross first incorporated asymmetric information into the study of capital structure. Ross assumed that corporate managers have internal information about the company’s future earnings and investment risks, while investors do not, but know the incentive system for managers, so Investors can only indirectly evaluate the market value of the company through the information sent by the manager. Corporate debt ratio or asset-liability structure is a signal tool that conveys internal information to the market. Since the probability of ruin is negatively correlated with the quality of the firm and is positively related to the level of debt, external investors regard the higher debt ratio as a signal of high quality, that is, the value of the firm and the proportion of debt are positively correlated (Ross, 1977).
- Myers and Majluf proposed the theory of priority financing, which believes that equity financing will convey negative information about business operations, and external financing will pay more for various costs. Therefore, corporate financing generally follows internal financing, debt financing, and equity financing.
- Huang Shaoan and Zhang Gang compared the listed companies in the United States and found that the financing behavior of Chinese listed companies has obvious equity financing preferences, while relatively neglecting debt financing.
- Wang Wei and Zhao Jun and Xiao Zuoping analyze the relationship between capital structure and company characteristics. The study finds that there is an optimal capital structure in China’s listed companies, and when there is a deviation between the actual capital structure and the optimal capital structure, Adjustments will be made, but compared to developed countries, adjustments are slower and asymmetric.
- Zhu Dexin and Zhu Hongliang, useL. L. Zhao Chinese data research to find that balance theory and superior order theory cannot explain the choice of Chinese enterprises’ capital structure separately. The choice of capital structure of Chinese listed companies may reflect the operator’s camera under specific financial conditions. The choice, at the same time, is largely influenced by external constraints.
Through the literature review, it can be found that when the literature studies the factors affecting the capital structure, are mainly concentrated in the company size, debt guarantee capability, non-debt tax shield, profitability, development opportunities. There is little literature on the impact of executive return on capital structure in domestic literature, but mainly on the impact of capital structure on executive return, while existing domestic and foreign literature studies the impact of executive return on capital structure. Mainly focused on the impact of executive stock ownership on the leverage ratio, especially the domestic literature rarely involves the impact of executive compensation structure on capital structure (Lanli Zhao, 2018).
Safestore Holdings Plc Average Annual Share Return
The return on a share of a company basically comes in two different ways, one is dividend income and other is price gain/loss. Shareholders hold their share for the intention of getting a return on the share purchased for a particular company. The analysis showed that financial ratios have a significant effect of predictability for forecasting returns of stock and they predict future stock return (Muhammad Bilal Khan, 2012). Calculation of share return of Safestore is given below:
Share Return =
| Year | Average Annual Price (£) | Dividend (£) | Return |
| 2014 | 187.77 | 6.92 | |
| 2015 | 264.35 | 9.65 | 44% |
| 2016 | 320.31 | 11.65 | 25% |
| 2017 | 396.27 | 14.00 | 27% |
| 2018 | 507.56 | 16.25 | 32% |
From the above table, it is clear that there is both an increase in average annual share price in the London stock exchange and also dividend payments is increasing. So, the return of share is also increasing year to year from 2015 to 2018.
Variation in the Capital Structure and Share Return of Safestore
Leverage plays an important role in explaining stock returns. The relationship between the use of leverage and stock return is not necessarily positive it can be negative also. The relationship may vary from industry to industry, company’s business to business and nature of assets.
Miller and Modigliani (MM) find that the returns increase in leverage in the utilities and oil and gas sectors. Gulnur Muradoglu and Sheeja Sivaprasad test this relationship in all the non-financial sectors. They find leverage to have a negative relation with stock returns in the overall sample they had taken. They also find that returns have a negative relation with leverage in the Consumer Goods, Consumer Services. The coefficient for leverage is positive in the Utility risk class which is similar to the results obtained by MM in 1958.
Incase of Safestore Holdings Plc the stock return is increasing year to year with the decreasing of use of leverage. This is a common fact which is matched with the findings of Gulnur Muradoglu and Sheeja Sivaprasad.
Safestore Holdings Plc Largest Investment Activities
Safestore’s property teams in both the UK and Paris are continually seeking investment opportunities in new sites to add to the store pipeline. However, investments will only be made if they comply with their disciplined and strict investment criteria.
- Largest Investment of Safestore Holdings was on 1st November 2017 for the purpose of increasing its capacity for Storage facilities around UK.
The Size of the Investment, and How it was Financed
- The size of the investment was £’m 55.9.
- Financing of this huge amount done through Bank Borrowings of £’m 369.90 in 2018.
The Purpose and Expected Outcome of this Investment
The purpose of this large investment for expenditure on investment properties and development properties.
- They have a pipeline of 210,000 sq ft of space across four new stores to be opened in 2019 in the UK in Carshalton in South London and Merry Hill in Birmingham and in Paris in Pontoise and Magenta.
The feasibility of the investment of Safestore looks good at both micro and macro levels in terms of business operation, service offering and increased demand for storage in UK and Paris. As they have a good business model and their financial strength is good, they are able to offer a more competitive price for their convenient services. Real estate investment has offered an above-average rate of return while acting as an effective hedge against inflation (
The Actual Outcome of this Investment
Since they relaunched their store opening strategy in summer 2016, they have opened six new stores in the UK in Chiswick, Wandsworth, Paddington Marble Arch and Mitcham in London, Birmingham, Altrincham and three stores in Paris at Emerainville, Combs-la-Ville and Poissy as well as completing the extension and refurbishment of our Acton and Longpont (Paris) stores. All of these stores are performing in line with or ahead of their business plans.
Development Stores and Under Construction
| Location | Square Feet | Year |
| Birmingham Merry Hill | 55,000 | 2019 |
| London Carshalton | 40,000 | 2019 |
| Peterborough | 42,000 | 2019 |
| Paris Pontoise | 65,000 | 2019 |
| Paris Magenta | 50,000 | 2019 |
| Total Square Feet in Pipeline | 252,000 | 2020 |
- 12 Alligator stores acquired to increase the capacity of service and increase the number of customers all around UK and Paris.
- Three new stores opened in the year at London Paddington Marble Arch, London Mitcham, and Paris Poissy. And seven now integrated into the business which pushes up the group revenue for the year up 10.8%
- Four new stores in the pipeline with 210,000 square feet of new space scheduled to open in London Carshalton, Birmingham Merry Hill, Paris Pontoise, and Paris Magenta.
Further details of the last twelve months’ activity are as follows:
- In April 2018, Safestore opened a new circa 54,000 square feet freehold store in Mitcham, in South West London. The site was acquired in December 2016 with the planning and building process taking just 16 months
- At the end of July 2018, they closed their leasehold Merton store and consolidated the majority of customers into our new Mitcham store. The closed Merton store had an MLA of 19,000 sq ft and an annual EBITDA of circa £0.1 million.
- In June 2018, they opened a new 37,000 sq ft leasehold store located between Paddington and Marble Arch in central London. The 46 lease is for a period of 20 years, with an option to extend for a further ten years. Their former 15,000 sq ft Paddington store closed in July 2018 with a significant proportion of its customers transferred to the new store.
- In October 2017, they completed the acquisition of a 1.34-acre industrial site at Merry Hill, around ten miles west of the center of Birmingham, in a very prominent location close to Merry Hill regional shopping Centre. They have now received planning consent and commenced building and expect to open a purpose‑built freehold 55,000 sq ft store in the second half of 2019.
- In the interim results this year, they announced that they had exchanged contracts to acquire a freehold site in Carshalton in South London subject to planning permission. They have now received planning permission and have completed the acquisition of the site. They anticipate opening the circa 40,000 sq ft store in 2019.
- In Paris, where regulatory barriers are likely to continue to restrict meaningful new development inside the city, they will continue their policy of segmenting their demand and encouraging the customers who wish to reduce their storage costs to utilize the second belt stores. They will also manage occupancy and rates upwards in the more central stores and ensure that pricing recognizes the value customers place on the convenience of physical proximity. The strong selling organization and store network established by Une Pièce en Plus in Paris uniquely enables it to implement this commercial policy to complement the strong second belt markets in which they operate.
- In June 2018, they exchanged contracts on a freehold 4.2-acre site in Pontoise, northwest of Paris, and have now received planning permission and completed the acquisition of the site in December 2018. They anticipate converting the existing building into a 65,000 sq ft store and that opening will be in 2019.
- In April 2018, they agreed on a lease on a site at Magenta in central Paris. Subject to planning, we aim to open a 50,000 sq ft store here in the 2019/20 financial year.
- In November 2017, they exchanged contracts on a site at Poissy, in the west of Paris, an area where we previously had no stores. They have since completed the acquisition of the site and opened the freehold 80,000 sq ft store in summer 2018.
- They believe there will be further opportunities to develop new stores in the outer suburbs of Paris and are actively reviewing the market for new opportunities.
- Following the year-end, they extended the lease on our Edinburgh Gyle store by ten years. The lease now has 18 years remaining and expires in 2036. In addition, a six-month rent-free period was agreed. In 2019 Safestore is Expecting to Increase their Conversion by
- a) Efficient marketing platform drives better-targeted inquiries
- B) Continued investment in pricing and analysis
- C) key role of store terms training and coaching
Conclusion
Safestore Holdings Plc provides self-storage facilities to customers throughout the United Kingdom (UK) and Paris. It is one of the UK’s largest self-storage group with 145 stores across the UK and in Europe. The current market capitalization is £1,343.26 million and the current year market average price is £606. The main competitor of Safe store is Big Yellow Group which also doing good business over the year. The financial performance is very much impressive in terms of capital structure, liquidity, net profit after tax and dividend payment. In the capital market, their stock price also increasing which is a good indication for the company.
References
An empirical test on leverage and stock returns (2008) Gulnur Muradoglu, Sheeja Sivaprasad.
Big_Yellow, 2019. Annual Report & Accounts 2018, s.l.: s.n.
Big_Yellow, 2019. Annual Report and Accounts, s.l.: 2019.
Gitman, L. J. Z. a. C. J., 2014. Principles of Managerial Finance. Fourteenth Edition ed. s.l.: Pearson.
Mladen Varga, M. V., 2007. FEASIBILITY OF INVESTMENT IN BUSINESS ANALYTICS. Journal of Information and Organizational Sciences, 31(2), pp. 61-74.
Muhammad Bilal Khan, S. G., 2012. Financial Ratios and Stock Return Predictability. Research Journal of Finance and Accounting, 3(10).
Nathan B. Berk, P. M. D., 2017. Corporate Finance. 4th ed. s.l.: Pearson.
Oprea, A., 2016. The importance of investment feasibility analysis. Journal of Property Investment & Finance, 28(1), pp. 58-61.
Razak, M. G. &. N. H. A., 2016. The Impact of Liquidity on the Capital Structure: Evidence from. International Journal of Economics and Finance, 8(10), pp. 130-139.
Richard A. Brealey, S. C. M. A. J. M., 2017. Fundamentals of Corporate Finance. 9th ed. s.l.: McGraw-Hill Education.
Safestore, 2016. Annual report and financial statements 2015, s.l.: s.n.
Safestore, 2017. Annual report and financial statements 2016, s.l.: s.n.
Safestore, 2018. Annual report and financial statements 2017, s.l.: s.n.
Safestore, 2019. Annual report and financial statements 2018, s.l.: s.n.
Safestore, 2019. Half Year Results Presentation 18 June 2019, s.l.: s.n.
S, N., 2016. The impact of capital structure on the Financial Performance of the firms. Journal of Business & Financial Affairs, 5(2).
Stephen A. Ross, J. F. J. R. W. W., 2015. Corporate Finance. 11th ed. s.l.: McGraw-Hill Education.
Welch, I., 2004. Capital Structure and Stock Returns. Chicago Journals, 112(1), pp. 106-132.
Xhaferi, S. X. a. B., 2015. Alternative Theories of Capital Structure. European Scientific Journal, 11(7), pp. 327-343.
Yaz Gu¨lnur Muradog˘lu, S. S., 2012. Capital structure and abnormal returns. International Business Review, Volume 21, pp. 328-341.
Zhao, L., 2018. Literature Review of Capital Structure. Scientific Research Publishing, Volume 9, pp. 1644-1653.
Written by
Email: [email protected]